BBSolutions Digital Services
Product · Crypto · Metals · Brazilian equities · Nasdaq · S&P 500

The market is screaming "buy".
Verax shows you what it is actually doing.

Verax Markets is a market reading dashboard that combines exchange order flow, on-chain data and price structure to answer a single question: what is the most likely scenario right now, and is it time to act or to wait? It is the same order flow institutions watch, read on your screen. You choose which markets to follow, from crypto to Brazilian and US equities.

Verax is not a signals platform. We do not say "buy here, sell there", we issue no entry alerts and there is nobody on the other side giving opinions. What the product does is cross dozens of independent indicators into confluence and show, with a percentage and the number of agreeing factors, which is the highest probability for that asset in each time horizon. This improves decision-making, prevents entering out of FOMO and puts on your screen the same data whales, large institutions and smart money track. The reading is yours, and so is the decision.
Inside the platform

This is what a subscriber sees on logging in.

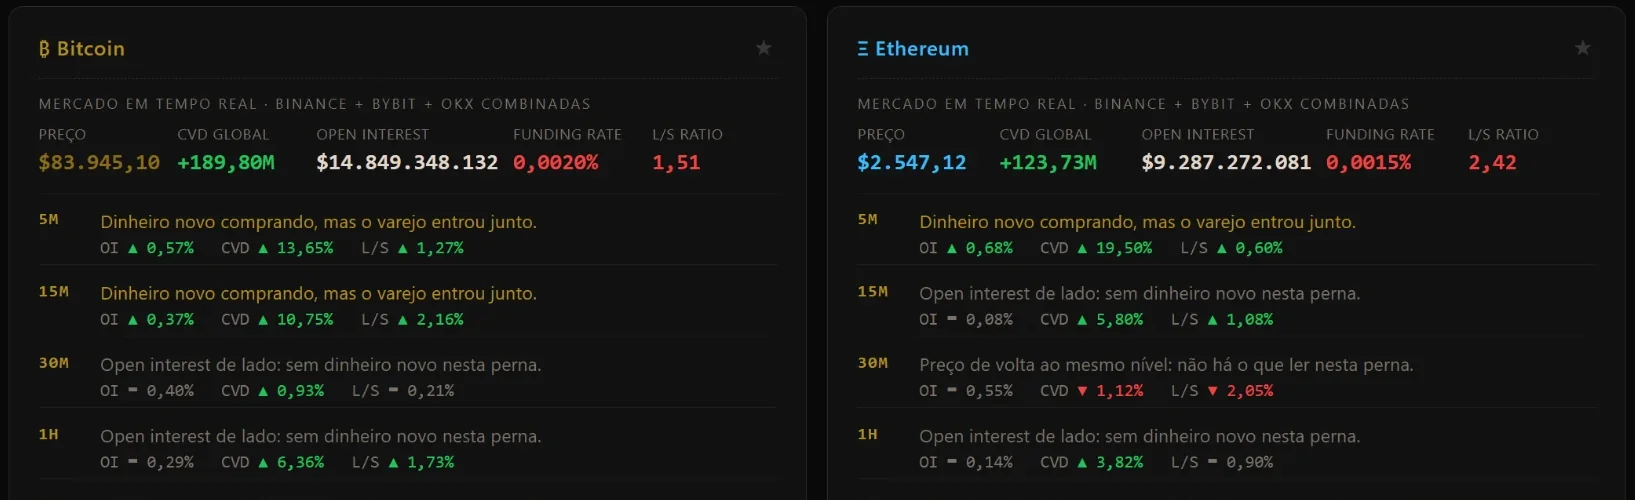
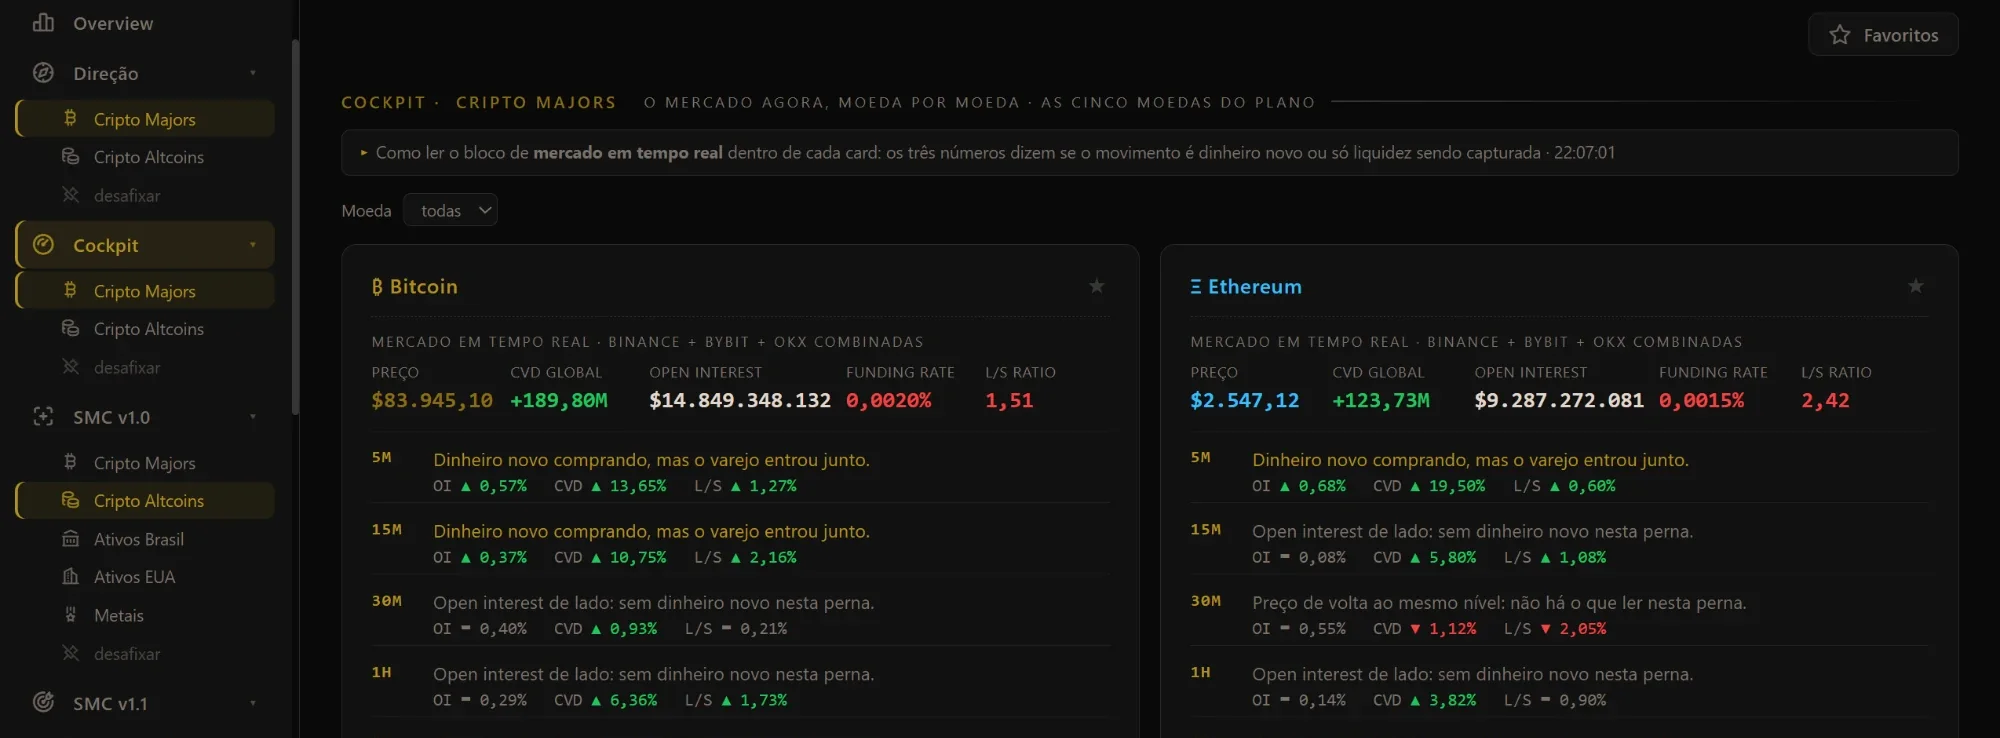
The menu with the modules on the left and the chosen screen beside it. Here, the Majors Cockpit: Bitcoin and Ethereum in real time, with Binance, Bybit and OKX combined and the sentence for each timeframe. Click to enlarge.

veraxmarkets.app · Cockpit · Crypto Majors
Verax Markets screen with the side menu and the Bitcoin and Ethereum Cockpit
The problem

Buying on impulse is the most expensive tax in the market.

Most retail investor losses do not come from bad analysis: they come from entering late, at the top of the euphoria, pushed by headlines and social media. By the time the rally reaches your feed, the move has usually already happened. Verax exists to be the rational counterweight to that impulse: a cold, data-based verdict, available around the clock before you click "buy".

One decision on Bitcoin, screen by screen

No mockups. This is the same BTC, from the cycle to the regions.

Six real screens, in the order a trader reads the market. Scroll down.

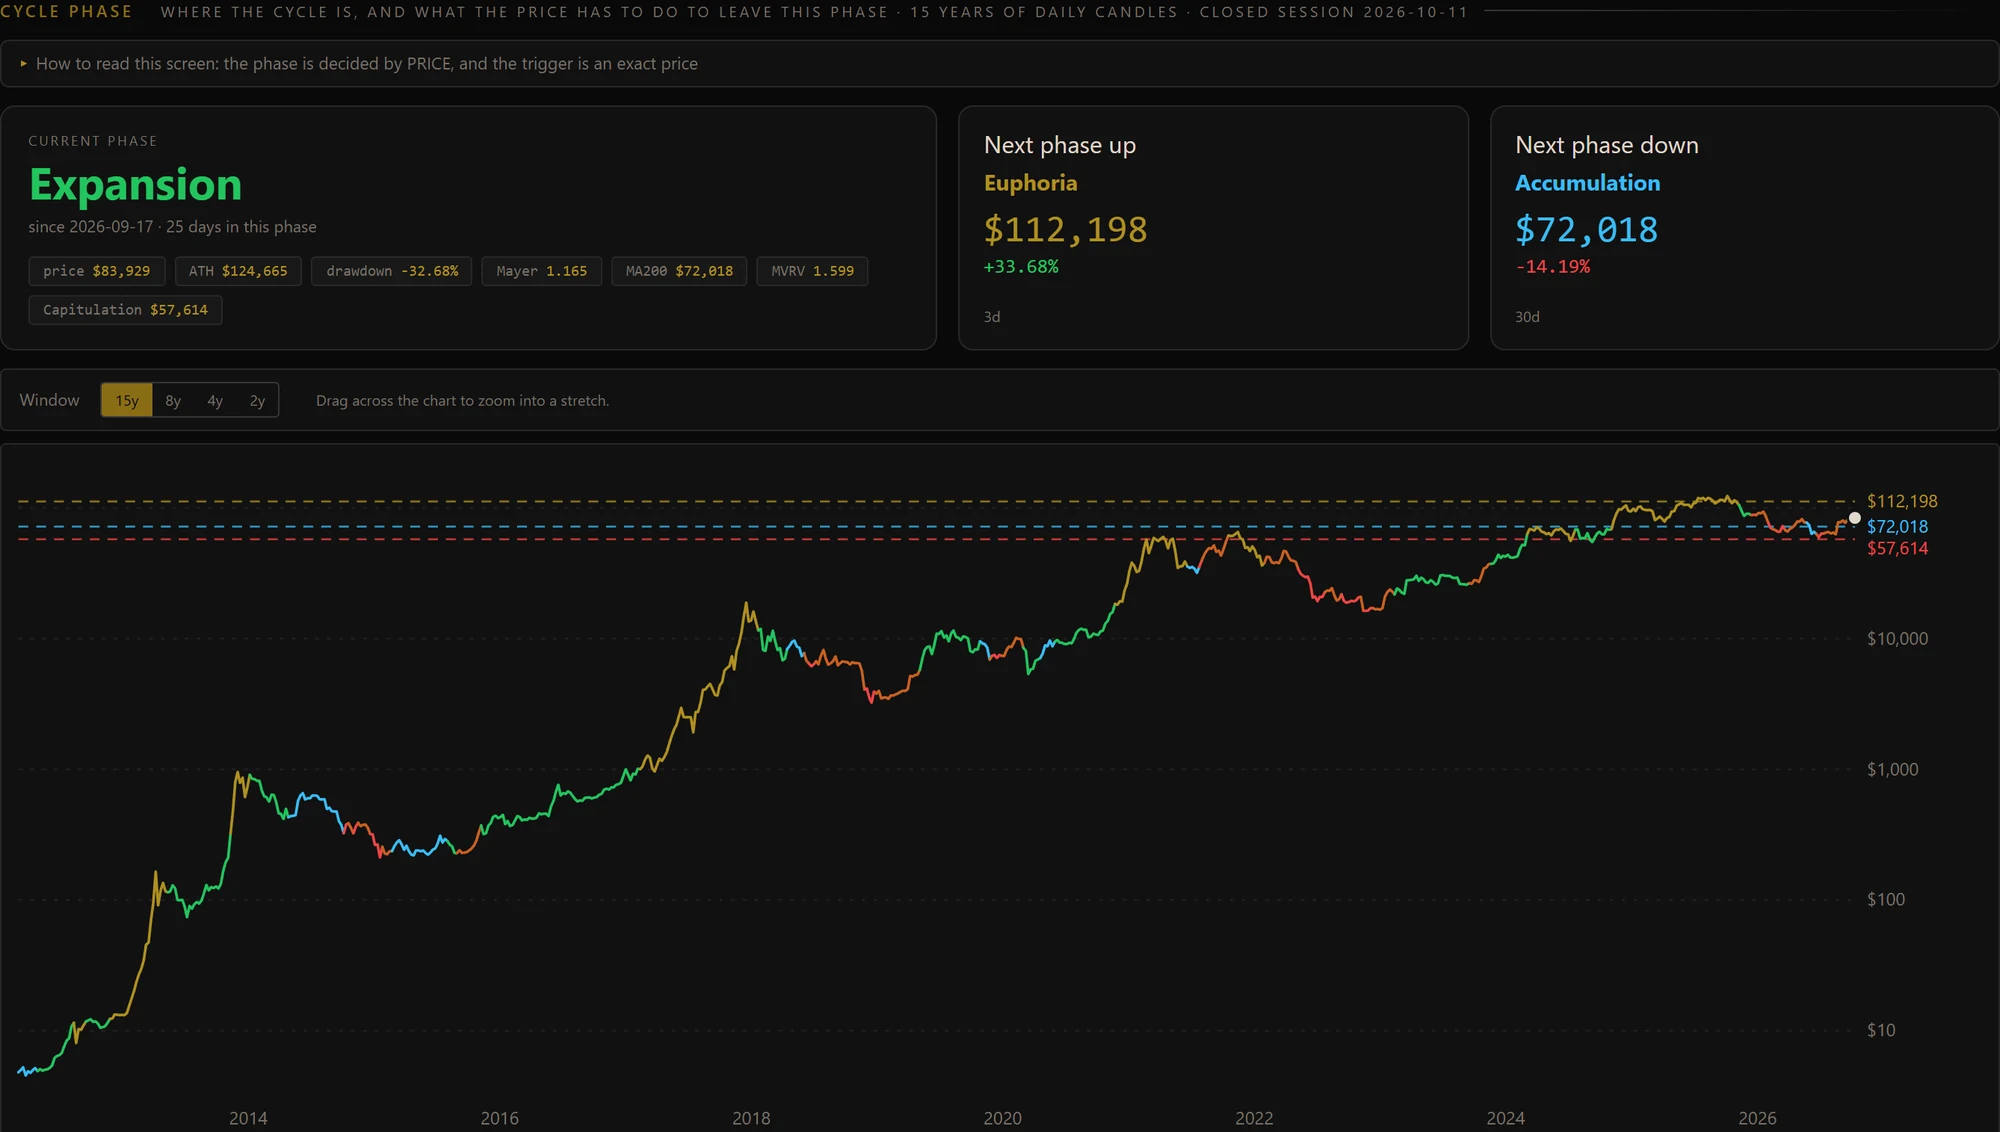
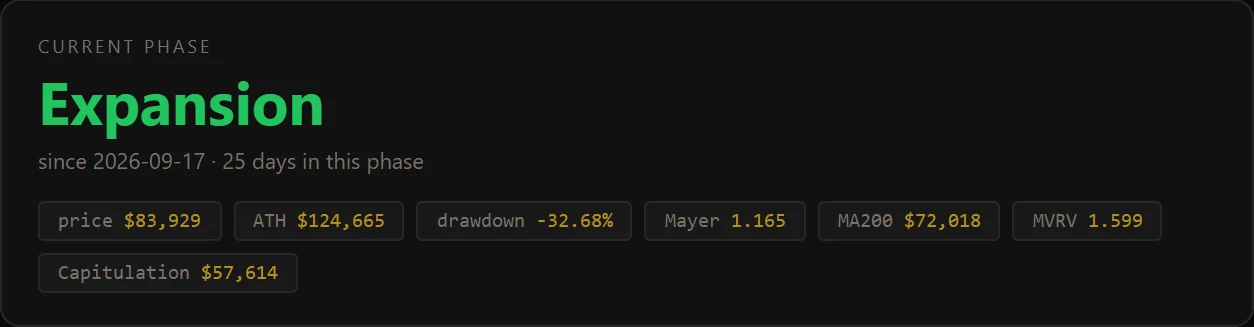
01 · Overview · Cycle

Which phase Bitcoin is in

Fifteen years of daily candles and the exact price that changes the phase, up and down.

In every plan Bitcoin cycle phase screen on Verax Markets, with fifteen years of price
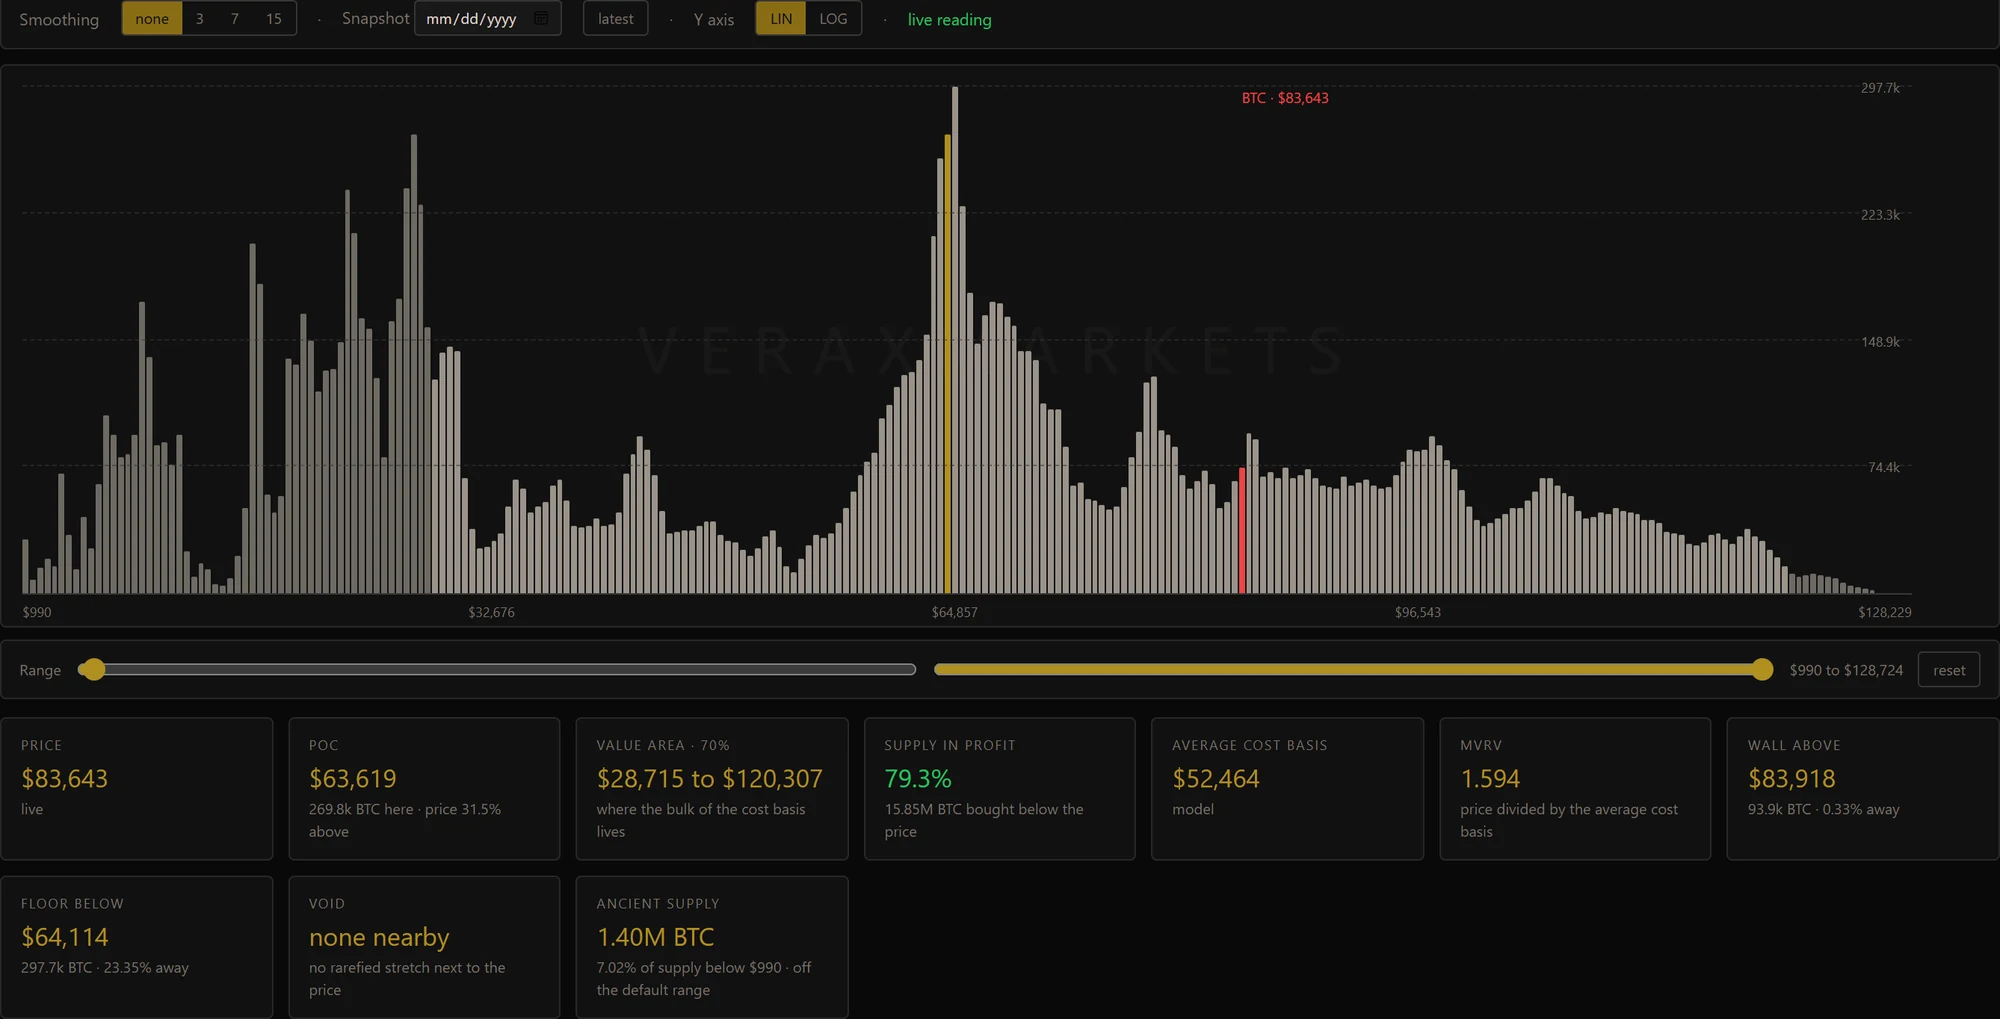
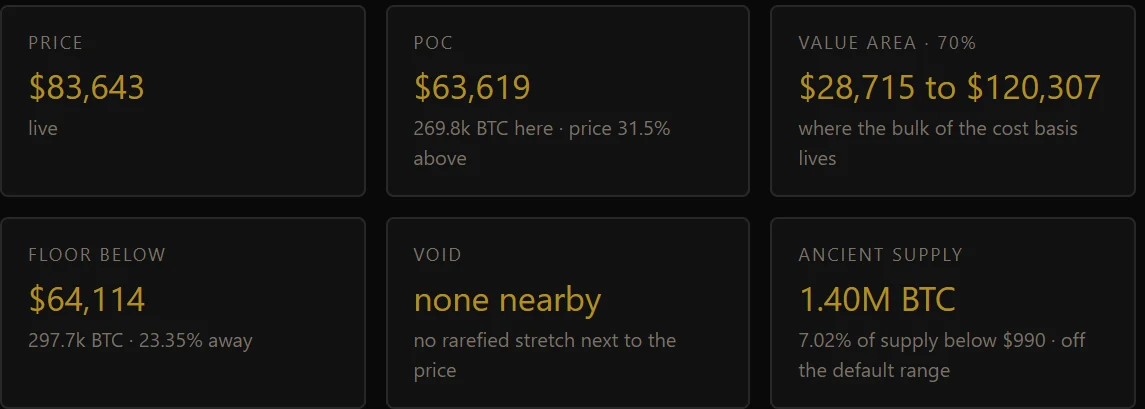
02 · Overview · Cost basis

Where the coins changed hands

The supply distribution by cost price shows floors and walls a regular chart does not.

In every plan Bitcoin supply distribution by cost price screen on Verax Markets
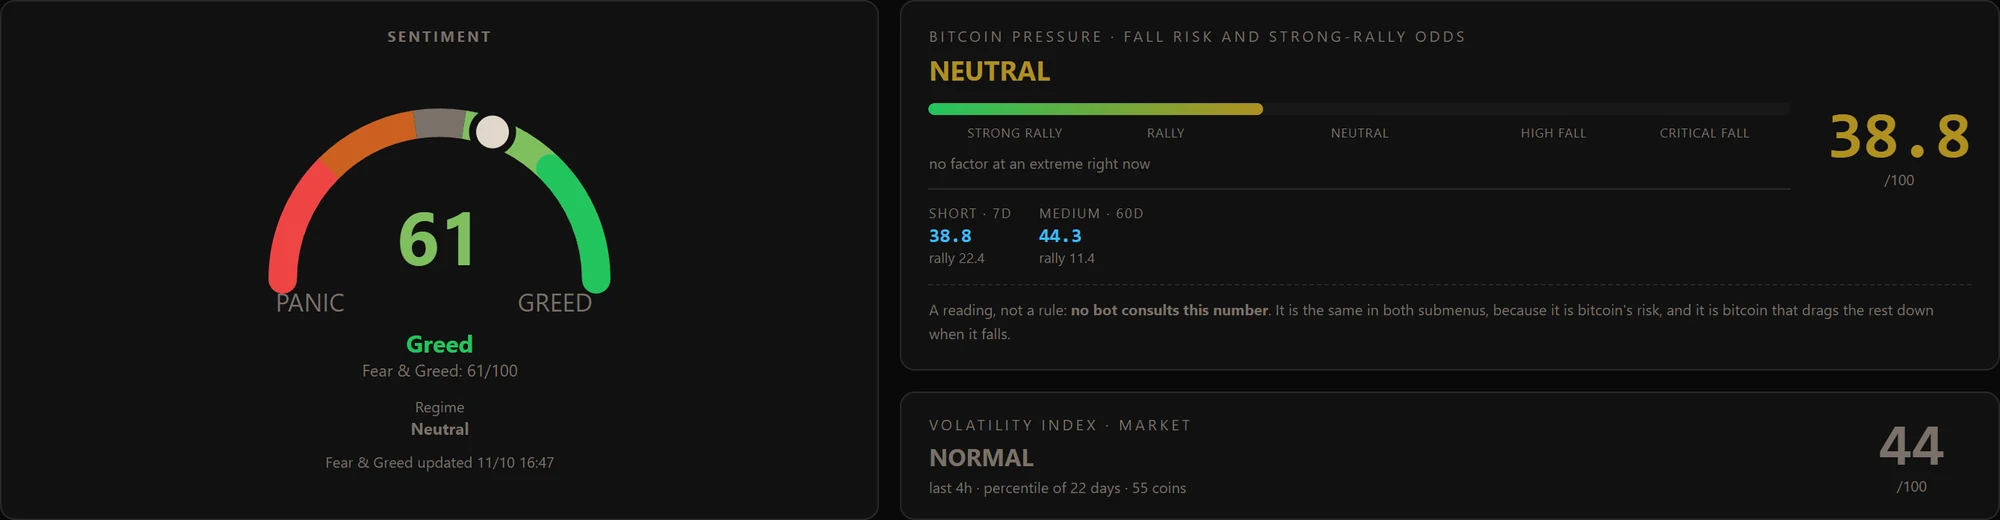
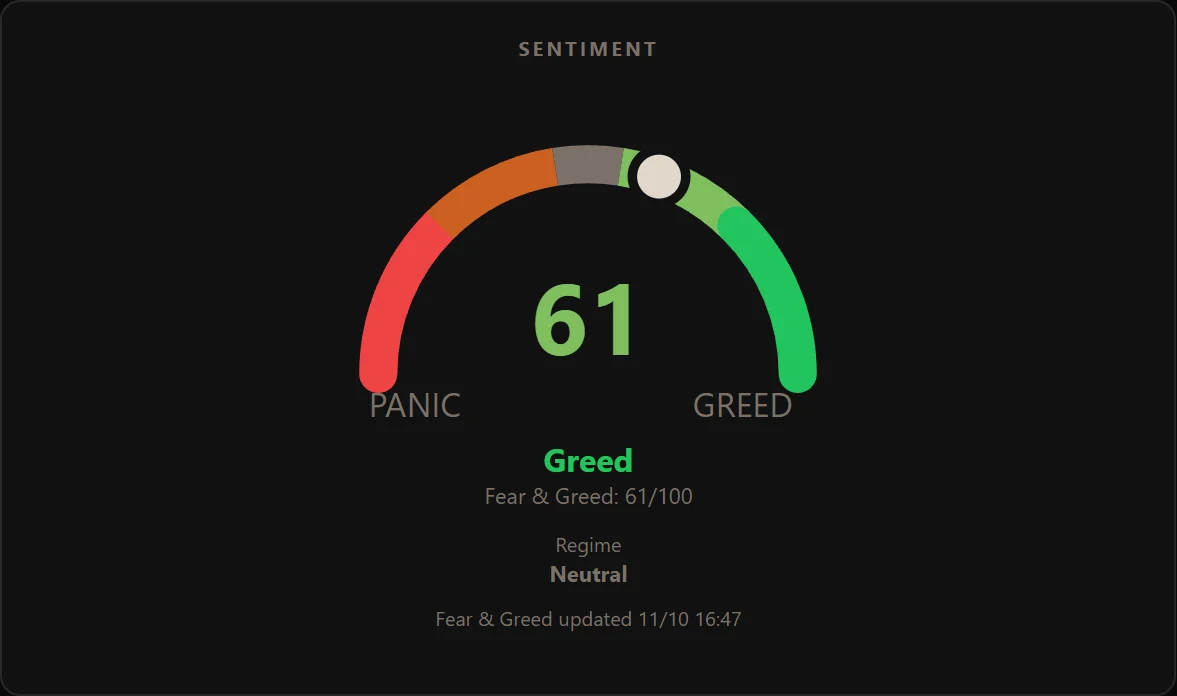
03 · Overview · Sentiment

The mood of the market now

Fear and greed, the downside pressure on Bitcoin and the volatility of the monitored coins, with the factors that weighed named.

In every plan Fear and greed, downside pressure and volatility screen on Verax Markets
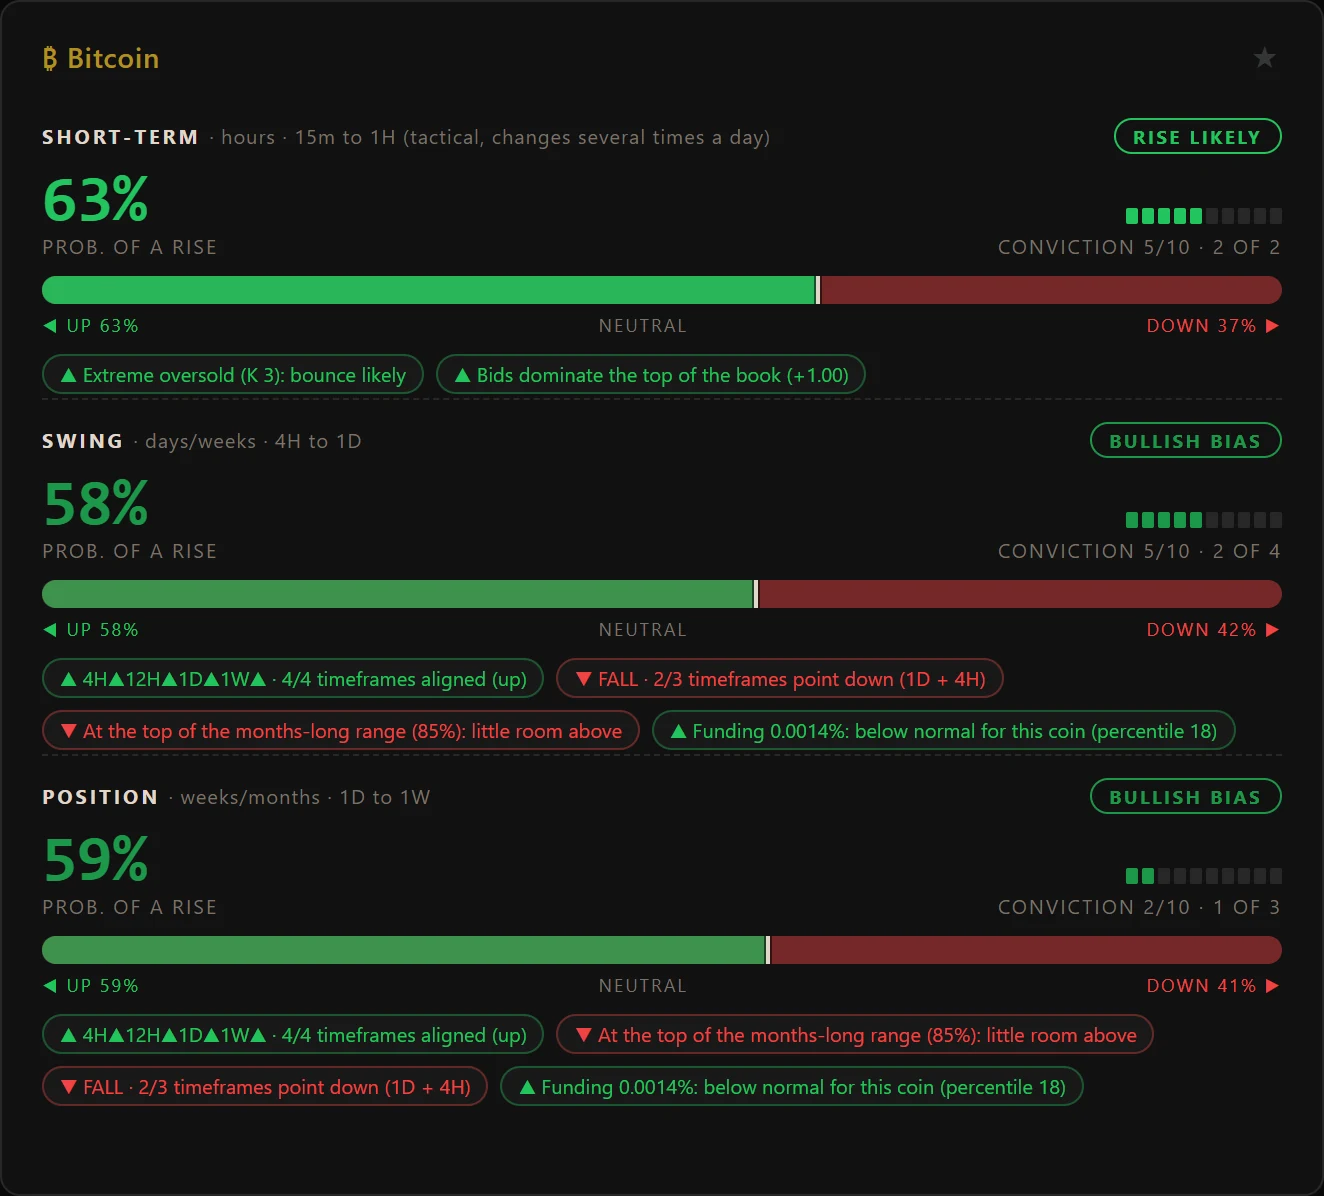
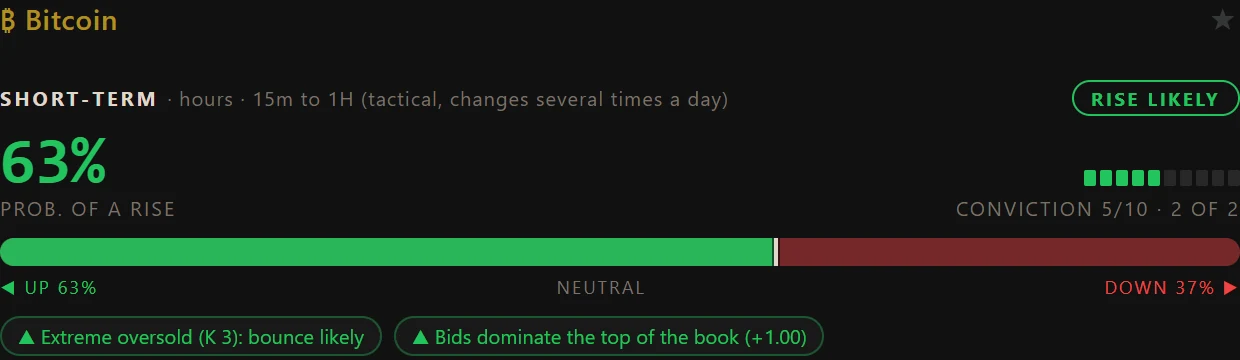
04 · Direction · Bitcoin

Short, swing and position side by side

Probability, conviction and the factors that agree and disagree. When horizons diverge, the screen says so.

Crypto plans Bitcoin direction screen across three horizons on Verax Markets, with probability and conviction
05 · Cockpit · Bitcoin

Who is coming in, timeframe by timeframe

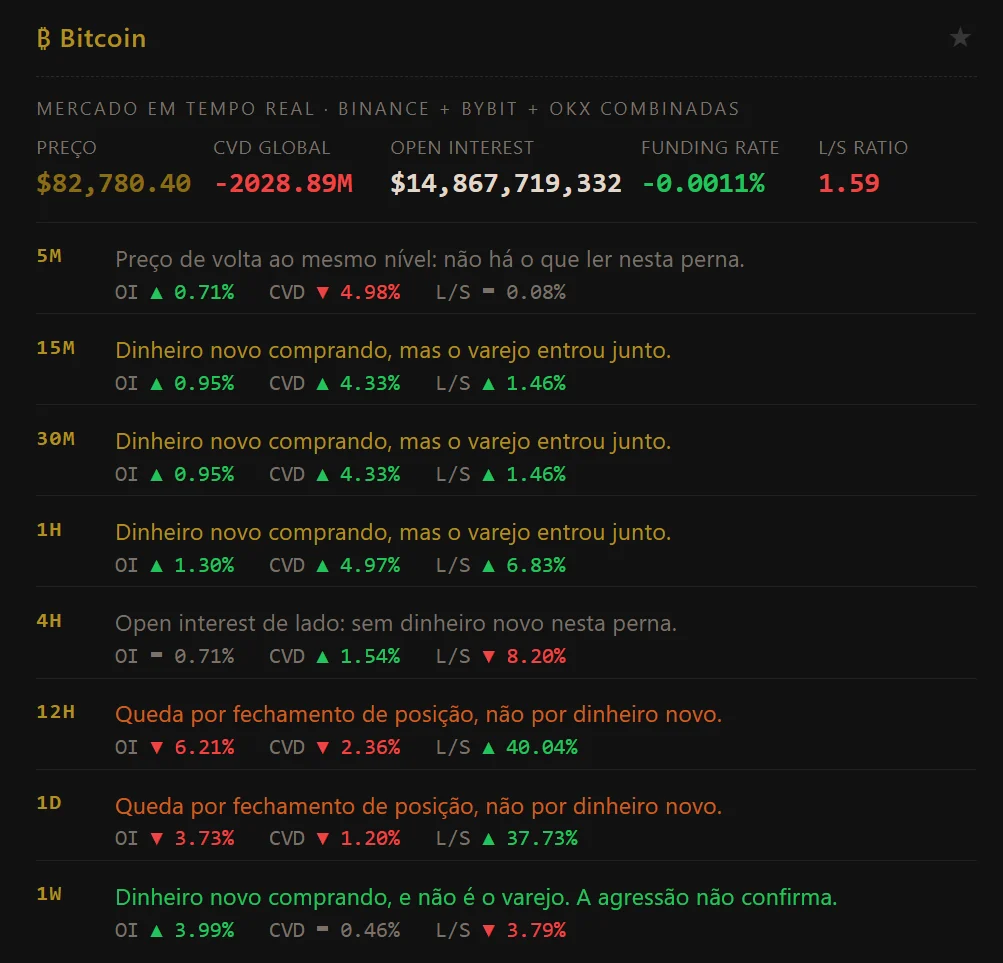
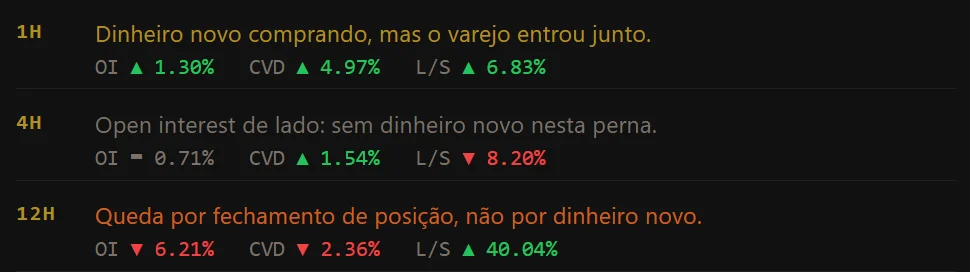
Binance, Bybit and OKX combined. On each timeframe, one sentence says if it is new money, retail or positions closing.

Crypto plans Bitcoin flow by timeframe screen in the Verax Markets Cockpit
06 · Region map · BTC

The supply and demand regions

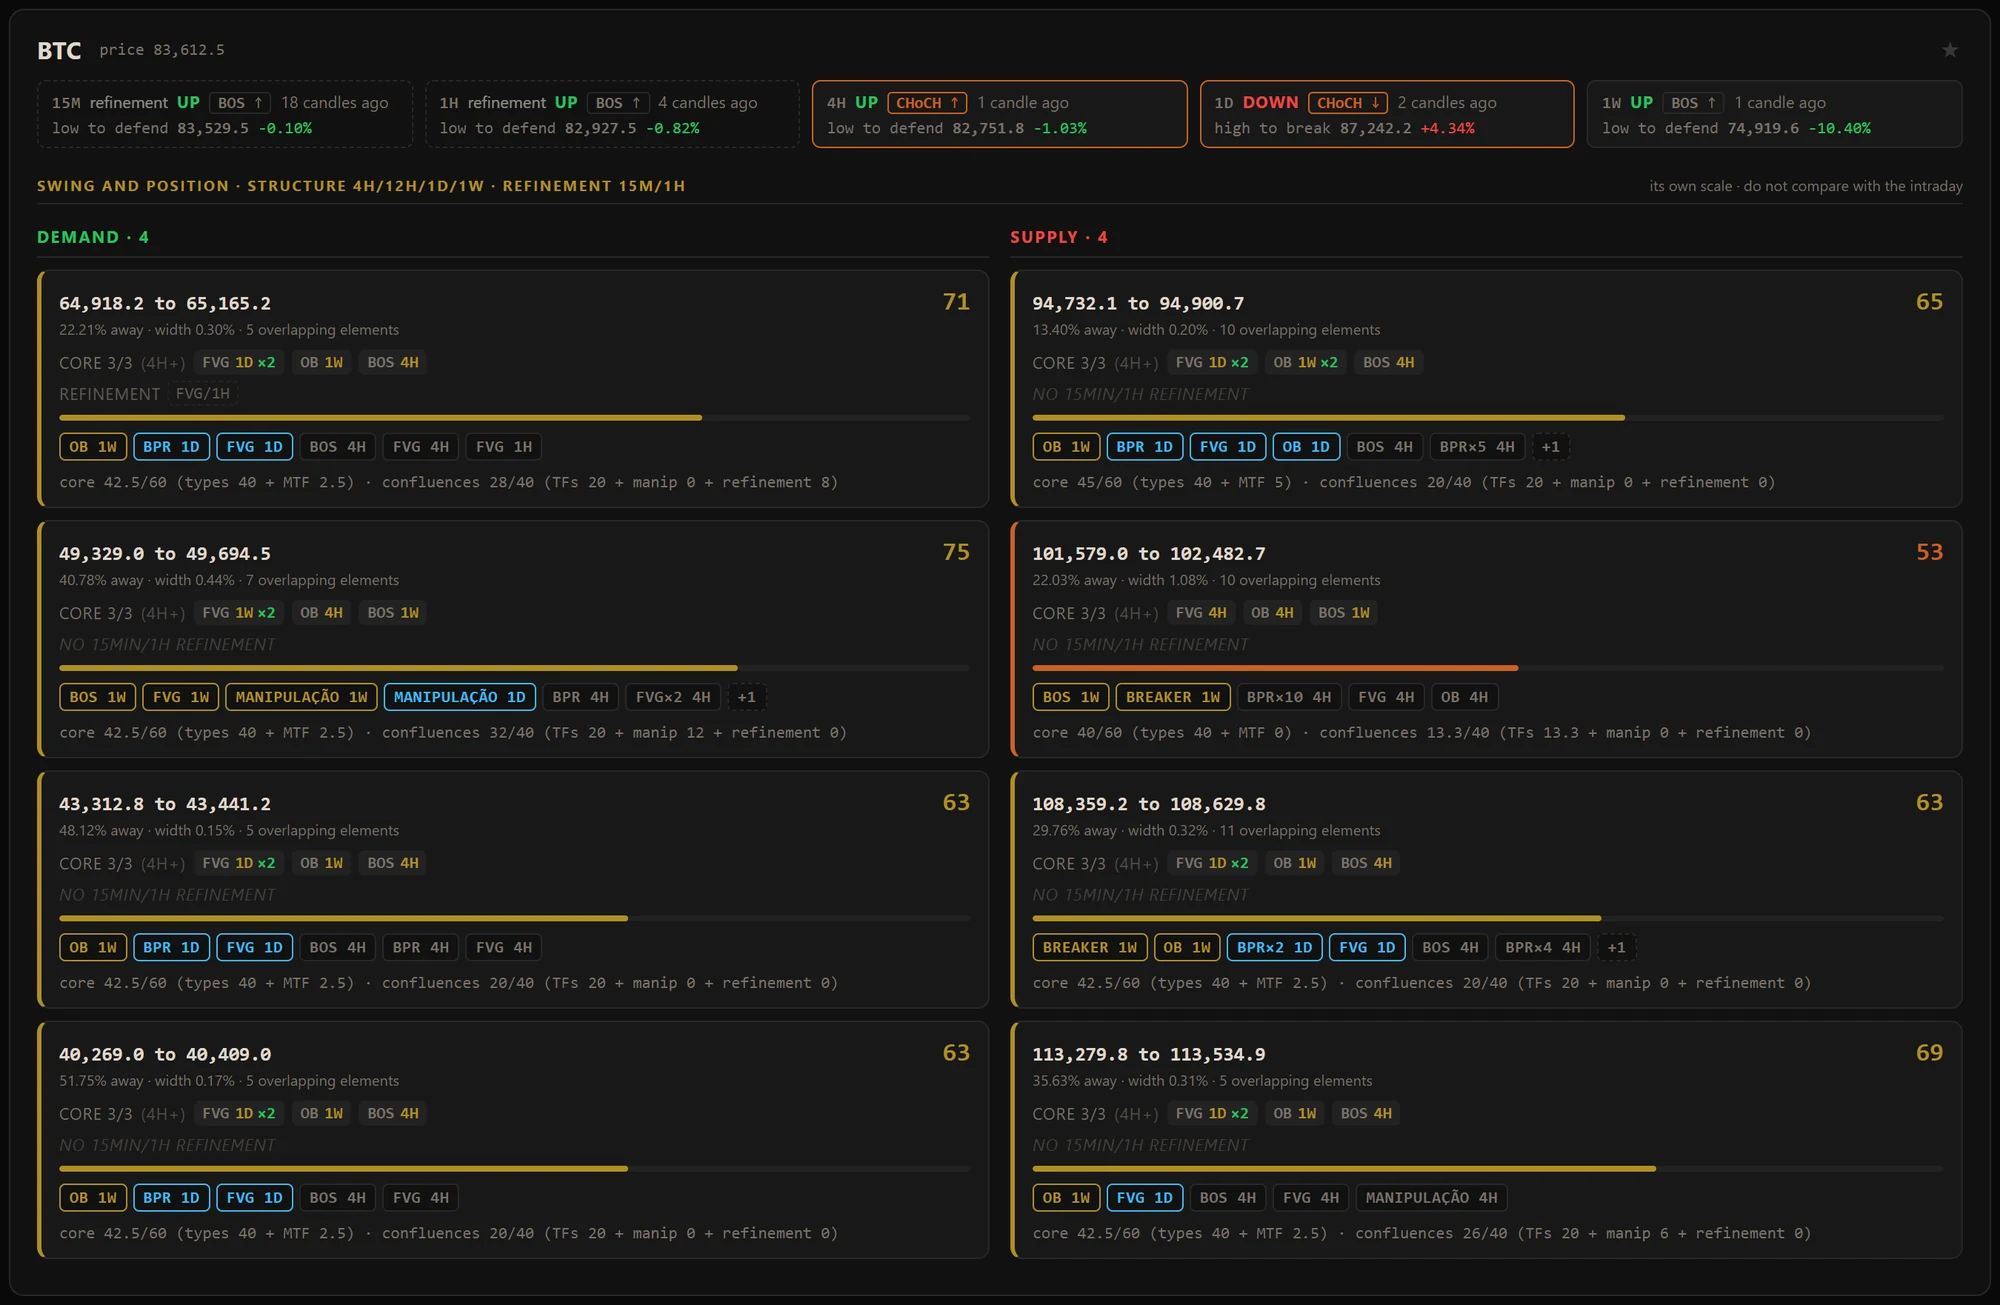
Bands where price tends to decide, with a score from 0 to 100, the distance from price and the elements that formed each one, from 4H to 1W.

All five markets Bitcoin supply and demand region map screen on Verax Markets
On the right side of the asymmetry

The signal is in the market. Reading it is what costs.

Aggressive flow, open interest, funding rate, retail positioning, book depth and liquidation pools exist in every trading venue. What almost nobody has is the operation capable of capturing that data without interruption, normalising different formats, storing history and crossing everything into confluence on every cycle. This is not software you install and forget: it is living infrastructure, with connection, processing and maintenance costs every month. That operation is exactly what you subscribe to here, instead of building it yourself.

What people usually believe
  • Institutions trade on data retail cannot see
  • There is inside information that explains the moves
  • Following one indicator is enough to know the right moment
  • The only way is to follow someone else's analysis and hope
What actually happens
  • The signal is scattered across dozens of sources that do not talk to each other
  • The advantage lies in crossing everything into confluence, with no delay and no bias
  • Keeping connections, history and continuous processing running has a real, monthly cost
  • Whoever pays that bill sees the whole picture. Whoever does not, sees a fragment
Exactly where the cost sits, since you deserve to know. Keeping permanent connections to three trading venues, reconnecting on every drop and handling rate limits. Storing and versioning the history that lets you compare today with thirty days ago. Recalculating indicators across five timeframes for every asset, every cycle, without stopping. Auditing the quality of what arrives and discarding what does not add up. And keeping all of it running on the day of panic, which is exactly when the most people log in. That is the cost the subscription covers, and that is why it exists.
What an institution watches, and where that shows up in Verax. Aggressive buying versus selling flow, which reveals who is executing at market instead of waiting in the queue, and retail positioning by the ratio of long to short accounts: in the Insights menu, the two appear side by side, coin by coin, showing whether fresh money is coming in and whether retail is on the same side or against it. Order book imbalance and pending liquidation pools, which show where price tends to be pulled. Open interest and funding rate, which reveal whether the move has fresh money coming in or is just old positions being stopped out. Structure across several timeframes at once, to separate noise from trend. That is exactly the list the dashboard delivers on one screen, and the product declares the source of every number.
The asymmetry in numbers, from the July 31 reading
68,8% of retail accounts were long in Bitcoin
72,4% long in Ethereum, with price down 2.9% on the day
seller was the side of real aggressive flow, the opposite of where the majority stood

Seven out of ten accounts on one side, the money that executes on the other. You do not need whale capital to see this. You need the instrument that measures it, and that is what you subscribe to here.

What this does not mean. Seeing the same data an institution sees does not turn anyone into an institutional investor, nor does it guarantee results. Institutions have capital, time horizon, risk structure and staff that a retail investor does not, and none of that is bought by subscription. Verax also does not move markets and does not replicate market-maker operations, which depend on execution infrastructure and latency beyond the reach of any dashboard. What the product does is close the gap in reading: you stop deciding without seeing the flow, and start deciding while seeing what it shows. The decision, the risk and the result remain yours.
What you get

Seven readings institutional terminals have and your broker does not show you.

Not every reading exists in every market, and we say which is which. Open interest and funding rates, for example, simply do not exist in the cash equity market. Each card below shows which plans that reading is available in.

01 · DIRECTION

Direction across three horizons

Short, swing and position side by side, each with probability, conviction counted in factors and the list of which agree and which disagree. When the horizons diverge, the dashboard says so instead of hiding it.

Crypto plans
02 · RISK

Severe downside risk

An index from 0 to 100 counting how many conditions historically associated with violent drops are present at the same time. Every factor that weighed in is named, including the one that disagrees with the rest.

In every plan
03 · VOLATILITY

Volatility index by percentile

From 0 to 100: the volatility of the last 4 hours against the coin's own history, because 55% is calm for an altcoin and agitated for Bitcoin. Compression precedes expansion; extreme is where mass stop-outs happen.

In every plan
04 · FLOW

Institutional flow reading

Who is buying and who is selling right now, separating the retail crowd by account positioning from the money executing at market by aggressive flow. That is where the asymmetry shows up.

Crypto plans
05 · EXCHANGES

Three exchanges in a single reading

Binance, Bybit and OKX combined: price, aggressor flow, open interest, funding rate and the long/short ratio, timeframe by timeframe, with one sentence that says if it is new money, retail or positions closing.

Crypto plans
06 · CYCLE

Cycle phase and cost basis

Bitcoin's cycle phase, decided by price over fifteen years of daily candles, and the supply distribution by cost price, which shows floors and walls a regular chart does not.

In every plan
07 · SENTIMENT

Fear and greed by market

In crypto, the market's own index. In stocks, ours, built from the market itself: momentum, strength, breadth, volatility and safe haven demand.

In every plan
A sentence written inside the dashboard itself, worth repeating here: it is a reading dashboard, and no strategy trades from it. The product assembles the full picture and shows where the evidence points. You are the one who decides, sizes and carries the risk.
The whole product

Everything a subscriber opens, module by module.

Real crops of the subscriber screen, with real data. Click any of them to enlarge.

veraxmarkets.app · Overview
Bitcoin cycle phase in the Verax Markets Overview
Overview Bitcoin cycle, cost basis and the pulse of the Brazil and US markets. In every plan
veraxmarkets.app · Insights
Verax Markets Insights with LINK, PENDLE and RAY on the swing horizon
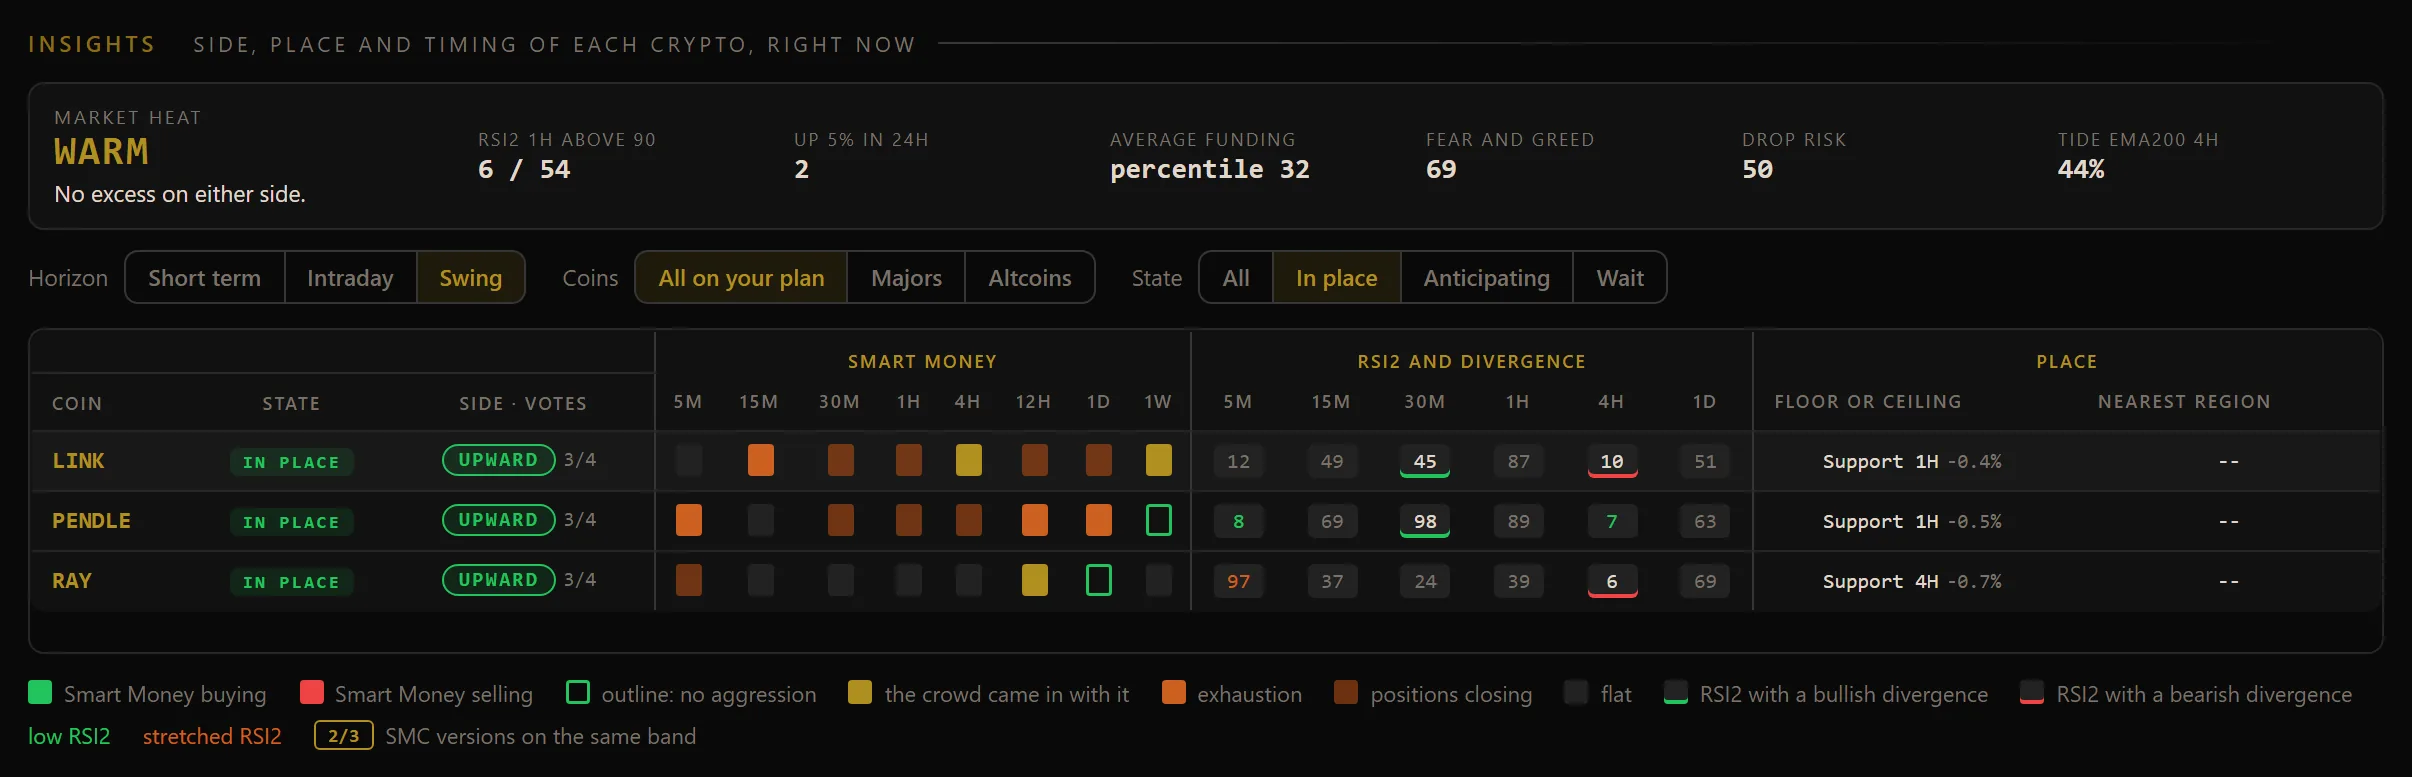
Insights Only the cryptos with side, place and timing aligned. Crypto plans
veraxmarkets.app · Direction
Bitcoin direction on three horizons in Verax Markets
Direction Short term, swing and position, with probability and conviction. Crypto plans
veraxmarkets.app · Cockpit
Verax Markets Cockpit with Bitcoin and Ethereum in real time
Cockpit New money, retail or closing positions, timeframe by timeframe, across three exchanges. Crypto plans
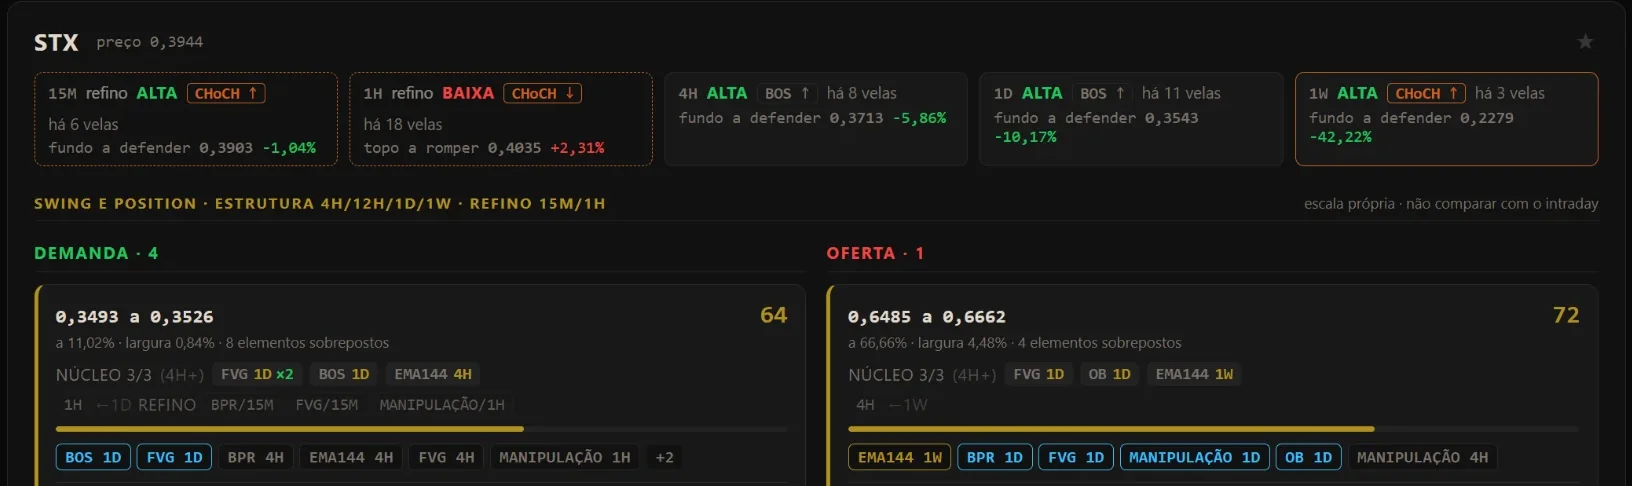
veraxmarkets.app · SMC region map
STX supply and demand region map in Verax Markets
SMC region map Supply and demand with the structure of each timeframe. In every plan
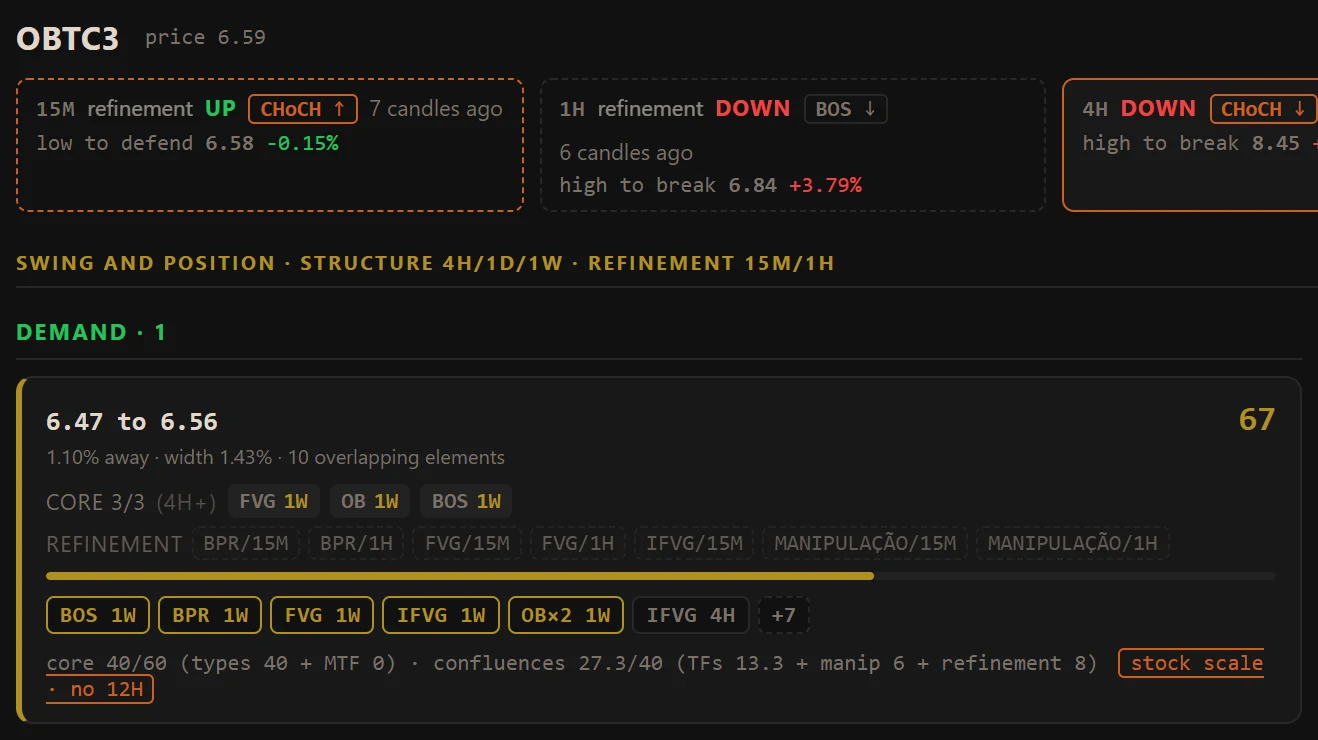
veraxmarkets.app · Stocks and Metals
Region map of a B3 stock in Verax Markets
Stocks and Metals The same region map for B3, NYSE, Nasdaq and metals. Stock plans and Majors & Metals
Insights

Only the crypto with side, place and timing aligned at the same time shows up.

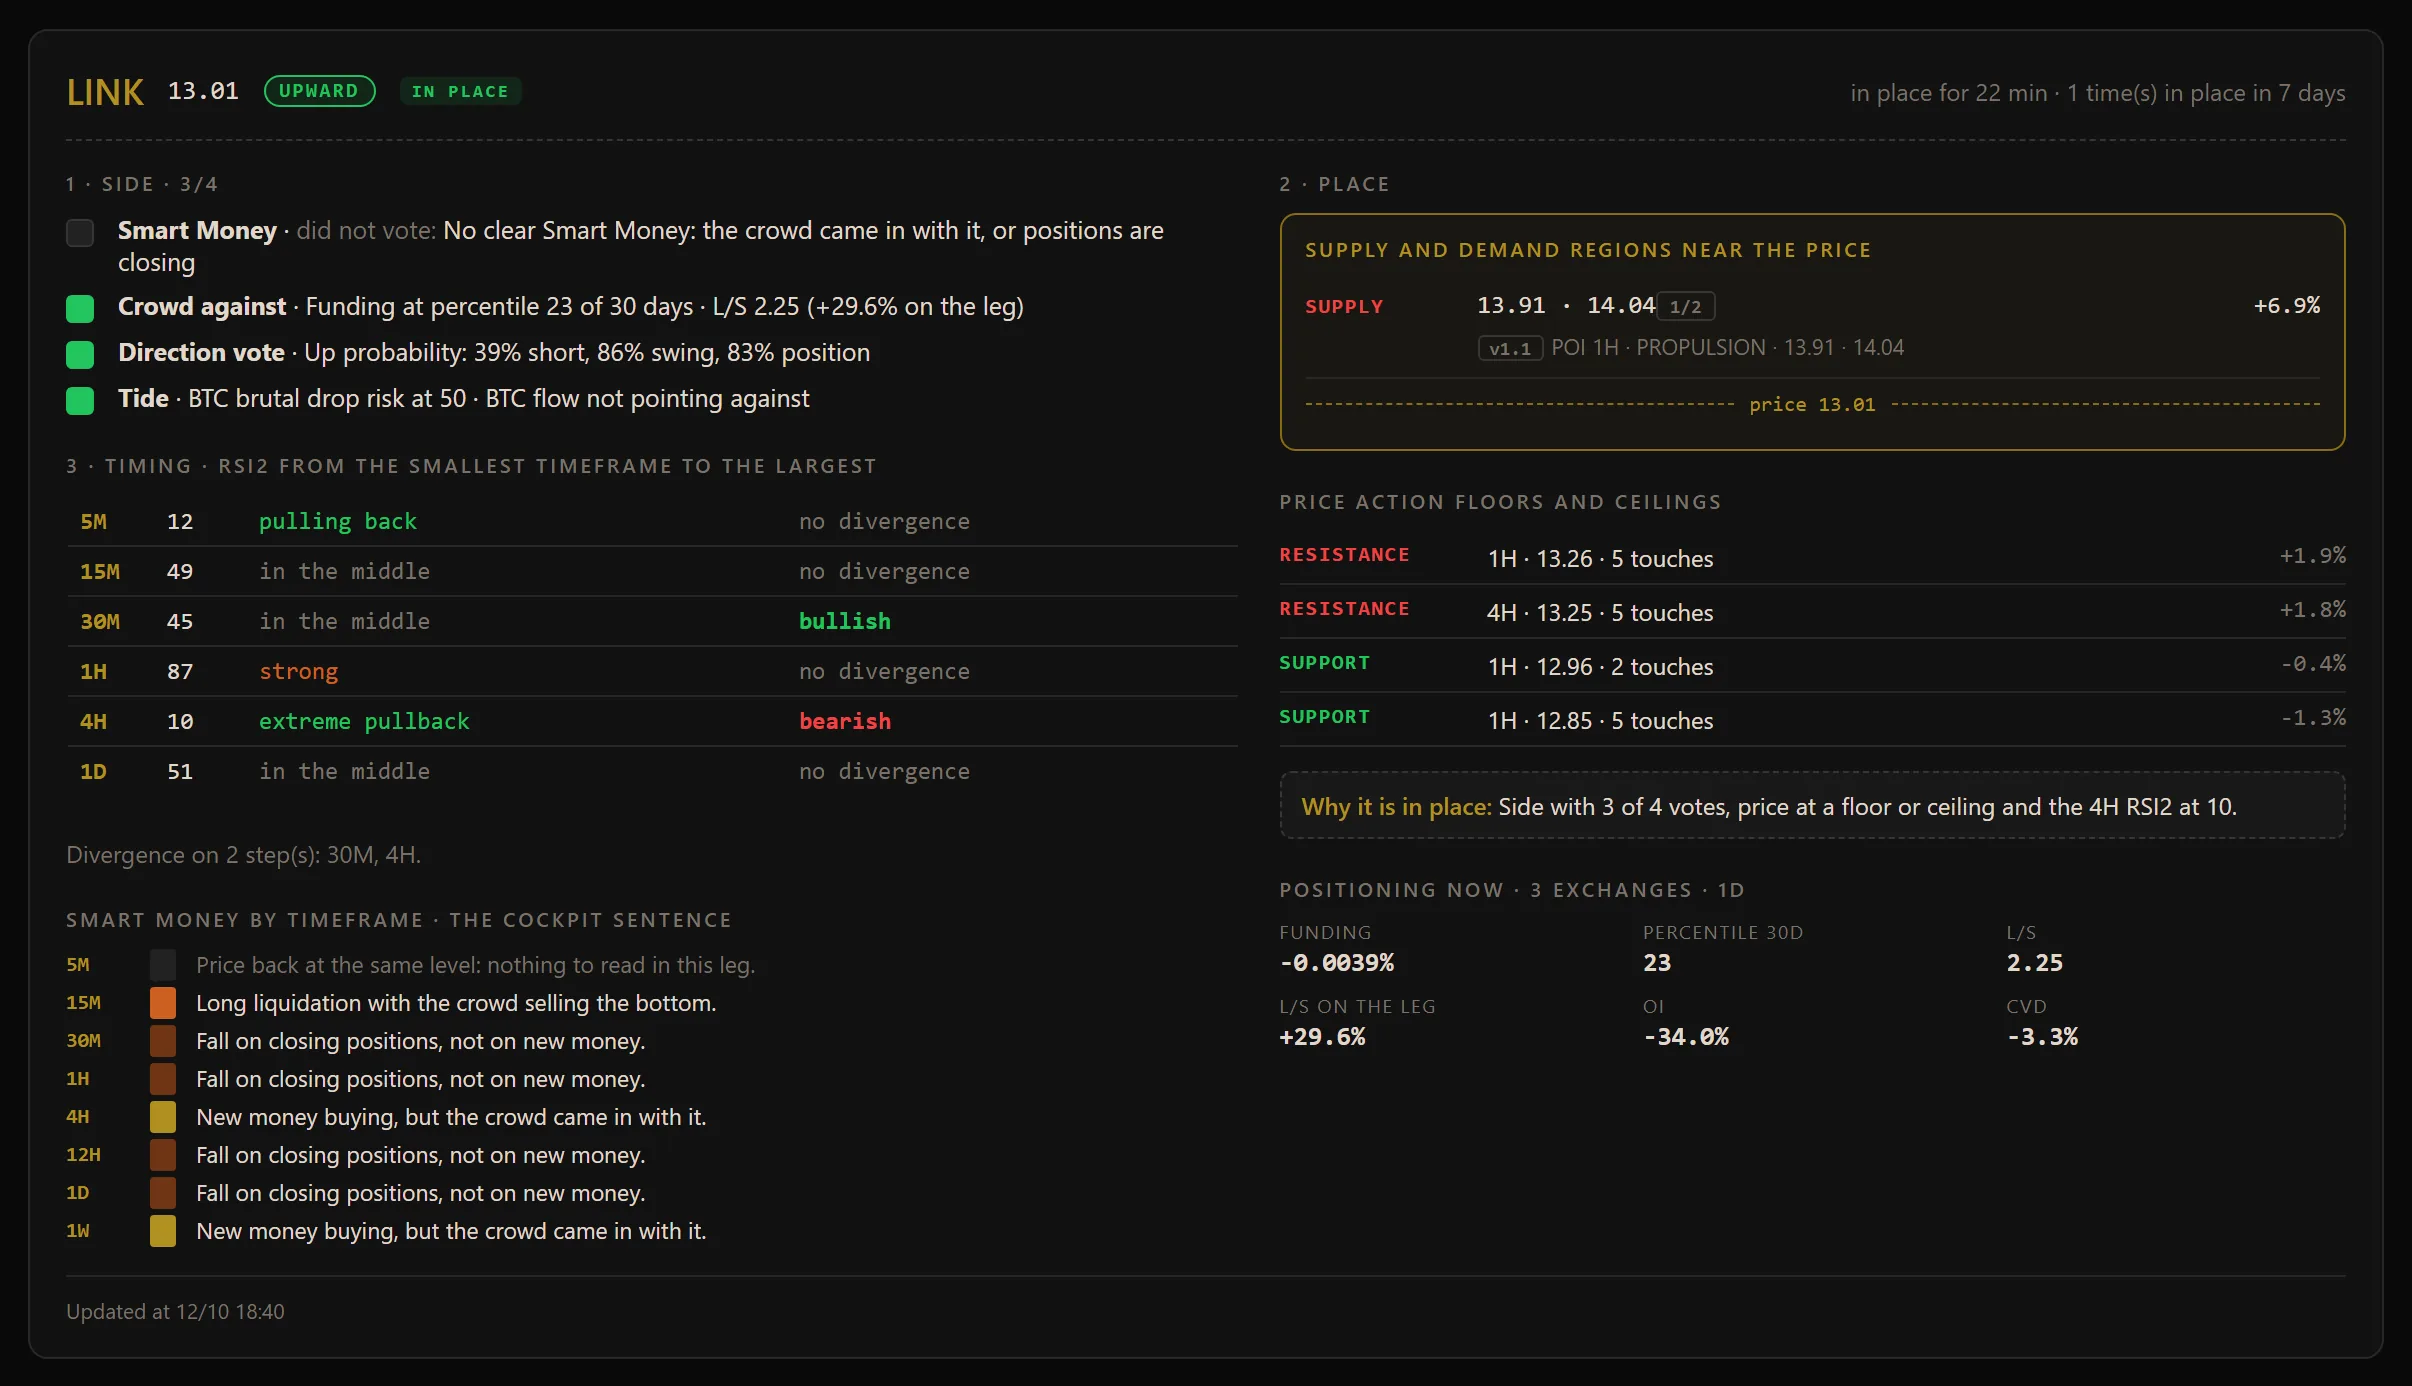
Insights reads every crypto on your plan at once and answers three questions per coin. Whatever fails any of the three stays off the screen: it is a filter against FOMO, not a list of tips.

veraxmarkets.app · Insights · swing · in place
Verax Markets Insights with LINK, PENDLE and RAY on the swing horizon
veraxmarkets.app · Insights · LINK
LINK detail in Insights: side votes, RSI2 by timeframe, regions and floors
1 · SIDE

Where the money is going

Four votes: Smart Money, retail on the other side, Direction and the Bitcoin tide. A side needs three.

2 · PLACE

Is the price at a good spot?

A supply or demand region from the SMC maps, or price action support and resistance less than 1% away, with nothing on the other side right on top of it.

3 · TIMING

Is it time, or is it FOMO?

RSI2 pulling back on the horizon timeframe, no short timeframe stretched, and divergences read from the smallest timeframe to the largest.

Real reading from 10/12/2026 at 18:40, on the subscriber screen. A market reading, not a buy or sell recommendation.

Crypto plans
Up close

The details of each screen, no mockups.

Real crops of the same BTC. Hover to pause and click to enlarge.

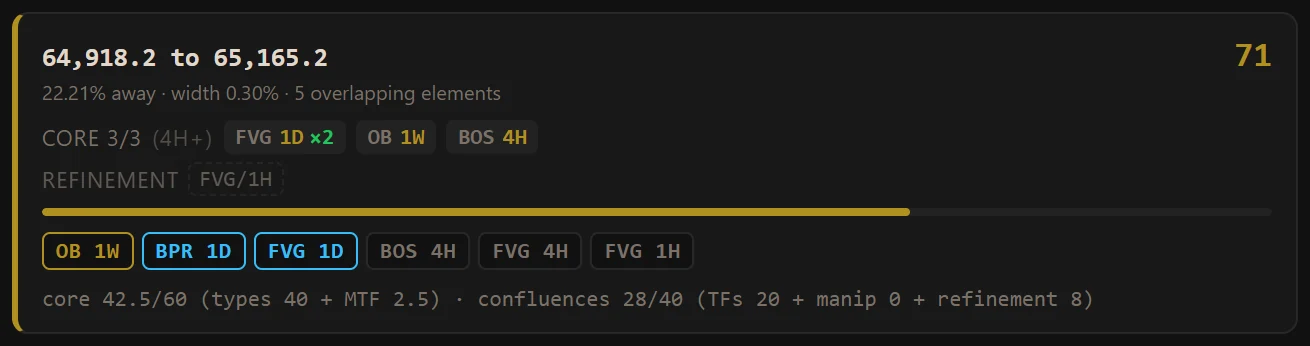
A Bitcoin supply and demand region on the Verax Markets screen
A BTC region
band, score and what formed it
Bitcoin cycle phase and the price that changes the phase, on the Verax Markets screen
Cycle phase
the price that changes the phase
Market fear and greed gauge on the Verax Markets screen
Fear and greed
the mood of the market now
Bitcoin short-term direction on the Verax Markets screen
Short-term direction
probability and conviction
Bitcoin cost basis figures on the Verax Markets screen
Cost basis
POC, value area and supply in profit
Bitcoin flow by timeframe in the Verax Markets Cockpit
BTC flow
new money, retail or closing
How Verax reads the market

Two readings, crossed: where price decides and the mood it arrives in.

The whole product is built on this. It is not an off-the-shelf indicator or a course recipe: they are two readings with a written rule, and any subscriber can check them on screen.

Pillar 1 · Structure

Smart Money Concepts, with a rule and no crooked drawing

SMC means reading where big money left a trace on the chart. The problem is that almost everyone draws SMC any which way: marking everything, erasing nothing, and ending up with a chart full of rectangles that mean nothing at all. Verax treats it as a rule, not as a freehand stroke.

Core · marks the region
  • FVG the three-candle inefficiency price tends to come back and fill
  • Order Block the last opposing candle before the impulse, where the large order went in
  • BOS the break of structure, which flips the polarity of the broken level
A region is only born with at least two of the three core elements, and they only count on 4 hours and above. Two 15-minute FVGs do not make a swing zone.
Confirmation · adjusts, never creates
  • Manipulation the false break that hunts stops before turning
  • Refinement the same elements on 15 minutes and 1 hour, for the trigger inside the region
A cluster without two distinct cores is discarded, however much confirmation it carries. That cuts the region count on purpose: a few solid ones are worth more than many plausible ones.
A zone price has already consumed leaves the map. An FVG dies when the gap is filled, an Order Block dies when price cuts through the body. The map shows what is still alive, not the history of what is gone.
Pillar 2 · Mood

Sentiment analysis, recorded as a series and not only in a panic

Structure says where. Sentiment says in what state of mind the market gets there. The same region reacts one way with the market in panic and another with the market euphoric, and ignoring that is like reading a map without knowing the forecast.

What goes into the reading
  • Fear and greed on a 0 to 100 scale, across the three markets
  • Retail positioning how many accounts are long against how many are short
  • Funding rate who is paying to keep a position open
  • Open interest whether money is entering or leaving the market
  • Aggressor flow who executes at market instead of waiting in the queue
  • Volatility measured on a short window, not a seven-day average that lags the reading
All of it is recorded as a historical series. Today's number is information; the series across months is context, and it is what shows whether today's fear is genuinely large or only large to whoever arrived yesterday.
In stocks and metals Verax does not show funding, open interest or positioning, which are crypto derivatives readings. In those markets the mood reading is narrower, and this site says so instead of pretending the screen is the same across all five.
It is the crossing of the two that becomes a decision. A structure region on its own says where price may react. Sentiment on its own says the market is stretched. Together they answer the question that matters: does this region have a real chance of holding, with the market in the mood it is in right now?
The main screen

A region, from the trail it left to the subscriber screen.

This is the screen a subscriber opens every day. Below, the same region told in three steps and then shown as it appears in the product.

1
Price breaks structure and leaves a trace. A large candle rises and opens a three-candle inefficiency along the way. Before it, the last selling candle was left unfilled. On 4 hours, the previous level breaks and flips polarity.
2
Verax requires two of them to coincide at the same price. A single element marks nothing. Here three coincide, all on 4 hours or above, and that is why the region is born. Were they two 15-minute FVGs, they would be discarded.
3
The region comes out marked, from bottom to top. The map shows the whole band of the region, the 0 to 100 score that says how reliable it is and the distance to the current price. What to do with it is your decision: Verax does not tell you where to enter, where to exit or where to stop.
veraxmarkets.app · Region map · BTCLIVE
A Bitcoin supply and demand region on the Verax Markets screen

Real capture of the subscriber screen, Bitcoin on Oct 11, 2026; click to see the full map. In the product, each asset has its own map, and a region leaves the map as soon as price consumes it. Nothing here is a buy or sell recommendation: it is a structure reading, and the decision is still yours.

How it works

Behind the dashboard, a quantitative engine that never sleeps.

01

Continuous collection, at the source

WebSocket and REST from three exchanges (price, aggressive flow, open interest, funding, liquidations, order book) plus on-chain metrics from the Bitcoin blockchain plus sentiment indices, 24 hours a day, 7 days a week.

02

Multi-timeframe processing

Every cycle of roughly 30 seconds, the engine recalculates indicators across five timeframes (15m to weekly), detects divergences, estimates liquidation pools and repositions each asset in the cycle phase.

03

Honest synthesis

The dashboard delivers probability, not promise: likely direction with a conviction percentage, impulse risk and context. When the market is undecided, Verax says "neutral", because staying out is a position too.

Source curation

Only three exchanges. And that is a quality decision, not a limitation.

There are hundreds of crypto exchanges in the world, and most market dashboards add them all up to display a big number. We do the opposite: we read only Binance, Bybit and OKX. Below are the figures that support that choice, each with its comparison universe stated beside it, because a percentage without a denominator means nothing.

68% of spot volume, when compared only against the exchanges with the highest trust rating in the industry reference index
53% of open interest, when compared with the five largest derivatives venues in the world
25% of open interest if you add up all 99 listed exchanges, including those with questionable volume. We publish this figure too
Why the third number is smaller, and why we show it anyway. Because the denominator changes everything. If you add up the declared volume of every listed exchange, the calculation includes venues that turn over their own book 8, 12 and even 18 times a day, a pattern of inflated volume that does not exist in a venue with real liquidity. On the list of highest spot volume in the market, the runner-up holds a trust rating of 3 out of 10, and three others in the top 10 rate 6 or below. Including those sources would raise our coverage number and lower the quality of the reading. We prefer to read less of the market, with data we can trust, and leave all three numbers in plain view for you to check.

To give a sense of scale: Binance alone is the world's largest derivatives venue by open interest, with roughly 15% of the global total, more than double the runner-up. Bybit and OKX complete the core where price actually forms.
01 · DADO LIMPO

No manufactured volume entering the calculation

Second-tier exchanges frequently inflate volume to climb rankings. When a dashboard consolidates those sources, it mixes real trades with invented numbers, and the indicator you read is contaminated at the origin. Filtering at the entrance is the only way to fix this, because no later calculation can separate what came in together.

02 · INFRAESTRUTURA

Sources that hold up on the bad day

It is precisely on the day of a violent drop, when you need the dashboard most, that smaller exchanges' APIs go down. The three we use run infrastructure sized for millions of requests per second and sustain the flow in moments of panic. Fewer dependencies means fewer points of failure.

03 · LIQUIDEZ REAL

The price you see is where you can actually execute

A thin order book shows a price that evaporates the moment someone tries to trade on it. Reading depth from an illiquid exchange means seeing an opportunity that does not exist. The three concentrate the depth capable of absorbing a large order without price slipping, and that is where the big money actually moves.

04 · ORIGEM DO MOVIMENTO

Where price is born, not where it arrives

Directional moves are born in the books of the largest venues and propagate to the rest milliseconds later. The smaller ones are a delayed reflection. By reading the origin instead of the echo, the dashboard sees the turn before it becomes consensus, which is exactly the interval that separates deciding from reacting.

Methodology: share measured over open interest and over normalised spot volume, from an industry reference index, as of August 2026. We use open interest as the main measure because it is the hardest to inflate artificially. The percentages move with the market and are re-measured periodically.

Subscription

Five markets live. You subscribe to the ones you trade.

There is no bundle and no "complete" plan being pushed. Each market is a subscription, and whoever trades one pays for one.

Promotional Price · 30% OFF on every plan until Nov 30, 2026
Anyone who subscribes by Nov 30 keeps the promotional price for as long as the subscription stays active. After that date, new subscriptions pay the full price.
Most complete
Crypto Majors & Metals
BTC · ETH · SOL · BNB · XRP · gold · silver · copper
See the 8 assets
BTCETHSOLBNBXRPOUROPRATACOBRE
was R$ 139.97 30% OFF
R$ 97.97/month
R$ 3.27 a day
Promotional Price until Nov 30
  • Map of decision regions
  • Derivatives cockpit
  • Gold, silver and copper, 24 hours
  • Full Overview: Bitcoin, B3 and US
Try 7 days free or subscribe now
Crypto Altcoins
the other monitored coins
See the 48 assets
AAVEADAAEROAIXBTARBASTERAVAXBCHCAKECRODOGEENAETHFIFARTCOINFETFLOCKGRASSHBARHNTHYPEINJJTOJUPLDOLINKLTCMERLMNTMORPHONEARONDOPENDLEPENGUPOPCATRAYRENDERSEISKYSPXSTXSUISYRUPTRXUNIVIRTUALXMRZECZRO
was R$ 211.97 30% OFF
R$ 147.97/month
R$ 4.93 a day
Promotional Price until Nov 30
  • Map of decision regions
  • Derivatives cockpit
  • Full Overview: Bitcoin, B3 and US
Try 7 days free or subscribe now
Brazilian Stocks
Brazilian exchange stocks, the Ibovespa index and USDC/BRL
See the 13 assets
BBAS3CASH3CMIG3CXSE3GOAU4IBOVMBRF3OBTC3PETR3ROXO34USIM5VALE3USDCBRL

Highlighted: the indices. The map reads their structure, but the index itself is not traded.

was R$ 97.97 30% OFF
R$ 67.97/month
R$ 2.27 a day
Promotional Price until Nov 30
  • Map of decision regions
  • Full Overview: Bitcoin, B3 and US
Try 7 days free or subscribe now
US Stocks
NYSE, Nasdaq, S&P 500
See the 25 assets
AAPLASSTBBAIBITXBLSHBMNRCGCCOINCRCLETHUFRMIFWDIGLXYHOODMARAMSTRNASDAQNVDAQBTSQUBTRGTIRXRXSP500SPCXTSLA

Highlighted: the indices. The map reads their structure, but the index itself is not traded.

was R$ 111.97 30% OFF
R$ 77.97/month
R$ 2.60 a day
Promotional Price until Nov 30
  • Map of decision regions
  • Full Overview: Bitcoin, B3 and US
Try 7 days free or subscribe now

Each plan is one market, and the Majors plan brings the metals along. You subscribe to as many as you want. No lock-in, no penalty and no sign-up fee: cancel it and it does not renew. The Cockpit exists only in crypto because its indicators come from derivatives, and stocks and metals do not have that data. Saying otherwise would be selling smoke.

Asset list as of 31/10/2026. An asset may join or leave monitoring, and inside the app the list shown is always the current one.

Add-on · for current subscribers
Telegram alerts When price reaches a supply or demand region in the markets you subscribe to, Verax calls you.
+ R$ 29.90/month added to your subscription Hire it in My subscription

Seven free days to try a market

Choose a market and use the full platform for 7 days, without paying anything: the decision regions and the direction across four horizons for that market. It is the whole product, not a stripped-down version.

The card is requested at the start and nothing is charged during the trial. If you do not cancel before day 8, the subscription for that market starts on that day. You cancel in one click, on the My subscription screen. One trial per person.

Choose your market and start the trial
7 days free · cancel before day 8 and pay nothing

What changes from one plan to the next

The map of regions is the same across all five markets: same rule, same confluence requirement, same four timeframes. What changes is the data source and what each market allows you to measure.

In crypto there is a derivatives market, so the Cockpit comes in: funding rate, open interest, retail positioning and the liquidation map. In stocks those numbers do not exist, and in their place comes the mood reading of the market itself: a fear and greed index from 0 to 100, built from momentum, strength, breadth, volatility and safe haven demand. In metals the reading is pure structure, on the Binance perpetual contract rather than ETFs, because the perpetual trades around the clock and delivers far more trading density.

Add-on · for current subscribers

Stop watching the chart. When price reaches the region, Verax calls you.

Telegram alerts for the markets you subscribe to: price reached a supply or demand region, and the alert brings the range, the score and what forms the region. The analysis and the decision remain yours.

On the Verax screen
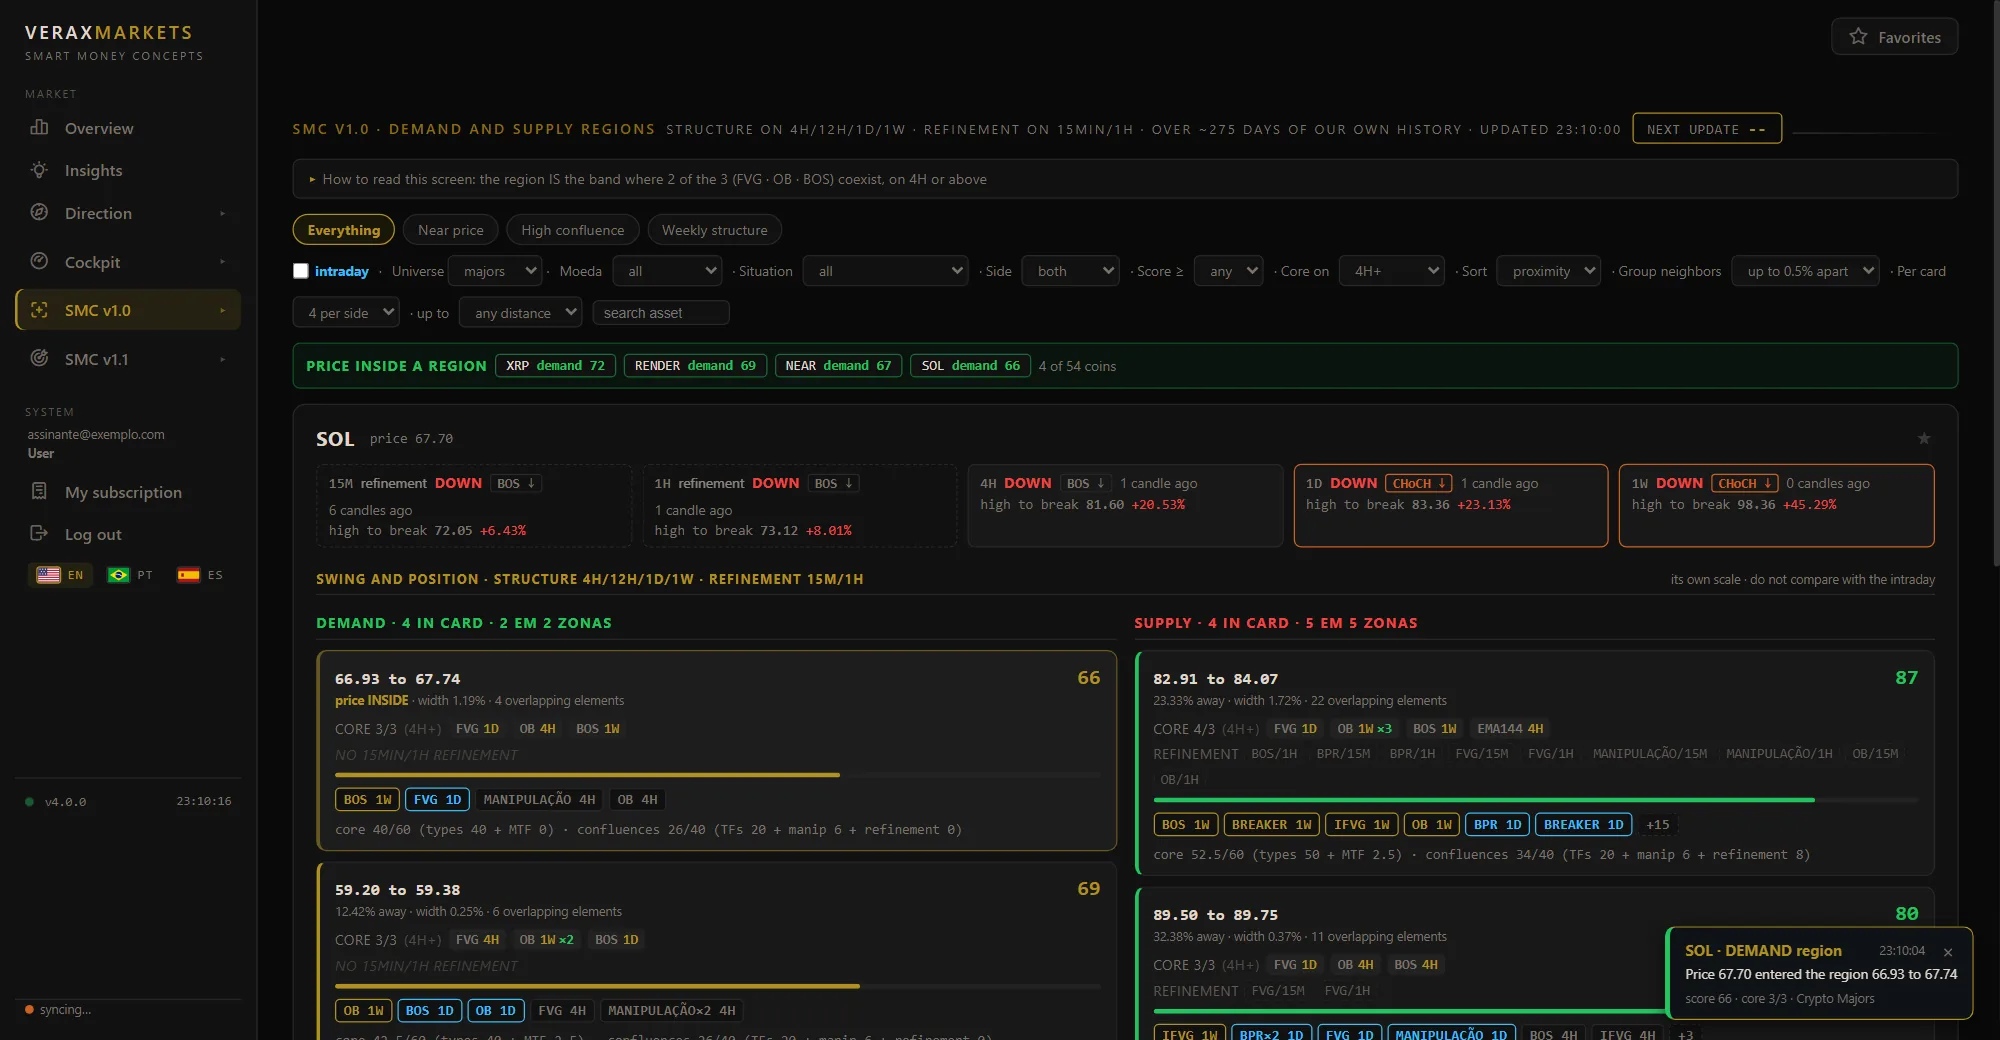
veraxmarkets.app · SMC v1.0 · Crypto Majors
Verax Markets screen with the SOL region map and the region alert in the corner
On your Telegram
V
Verax Marketsbot
23:10
SOL · DEMAND REGION range 66.93 to 67.74
price 67.70
score 66 · core 3/3 FVG 1D · OB 4H · BOS 1W Crypto Majors · Jun 3, 23:10 (Brasília) · #A7K2
Open SOL in Verax
  • Protected alerts: no forwarding, copying or saving
  • Hours and assets from your Notifications menu
  • Only the region: no entry, stop or target
+ R$ 29.90per month, added to your subscription · free during the 7-day trial
Hire it in My subscription

Screen and alerts from the same moment: June 3, 2026 at 23:10, when SOL entered the demand region. The map was rebuilt by the Verax engine from real Bybit candles up to that minute.

Frequently asked questions

Before you subscribe

Does Verax tell me when to buy and sell?
No, and that is deliberate. Verax shows the most likely scenario and the risk that you are acting on emotion. The decision is always yours. Tools promising a "sure signal" sell lottery tickets; we deliver a probability reading.
Do I need to understand technical analysis?
No. The dashboard translates everything into plain language: low/moderate/high risk, direction with a conviction percentage and one line of context. Advanced users find the depth in the details; beginners grasp the essentials in seconds.
Where does the data come from?
Straight from the source, over a connection we keep alive 24 hours a day. In crypto, three major exchanges via WebSocket and REST, on-chain metrics read directly from the blockchain and recognised sentiment indices. In metals, the Binance perpetual contract for gold, silver and copper, which trades around the clock. In stocks, quotes delayed by 15 minutes. No data comes from "influencer consensus".
What exactly is available today?
All five markets, live and available today, in four plans: crypto majors with gold, silver and copper, crypto altcoins, Brazilian stocks and US stocks, with the price of each on the plan cards. Each one delivers the map of decision regions across four timeframes and the full Overview, with the Bitcoin reading and the fear and greed of B3 and the US. The two crypto plans also include the derivatives Cockpit.
Can I subscribe to more than one market?
Yes, and that is how most people use it. Each market is an independent subscription, added to the same account and the same screen. Subscribing to crypto majors and Brazilian stocks, for example, opens both maps, with no bundle in between. Whatever you did not sign up for does not show up open: the trimming happens on the server, not by hiding it in the browser.
Why does each market have a different price?
Because each one delivers something different. The two crypto plans include the derivatives Cockpit on top of the map, and the altcoins plan covers about 50 coins instead of 5. Stocks and metals include the map and the reading specific to each market, without the Cockpit, which does not exist outside crypto. We prefer to explain the difference rather than charge one flat price that hides the bill.
Can I cancel whenever I want?
Yes. The subscription is monthly, with no lock-in and no penalty. Cancel it and it does not renew.
Is this investment advice?
No. Verax Markets is an information and education tool. We do not manage portfolios, do not recommend assets and do not guarantee results. Crypto assets and equities are risky investments: invest only what you can afford to lose.
Legal notice: Verax Markets is an information and technology product. The content shown is strictly informational and educational and does not constitute a recommendation, advisory service or securities analysis under Brazilian securities regulation. Past performance does not guarantee future results. Crypto assets and equities are volatile and carry the risk of losing invested capital, which in crypto assets may be total. Exchange data may be displayed with a delay according to the rules of the provider and the originating exchange.
BBSolutions Talk to us on WhatsApp